
Empower Your Supply Chain with Data-Driven Quality Insights
Track your order progress in real time with the GIS Intelligent Management System—empowering global buyers with inspection dashboards, defect analytics, and smarter supplier management.

Save time & money with GIS
Quality Management System

Real-Time Inspection Tracking

Advanced Defect Analytics

Strategic Supplier Benchmarking

Seamless Supply Chain Integration
Take Full Control of Quality and
Supply Chain Performance
Section 1: Inspection Overview – Digital Intelligence Dashboard
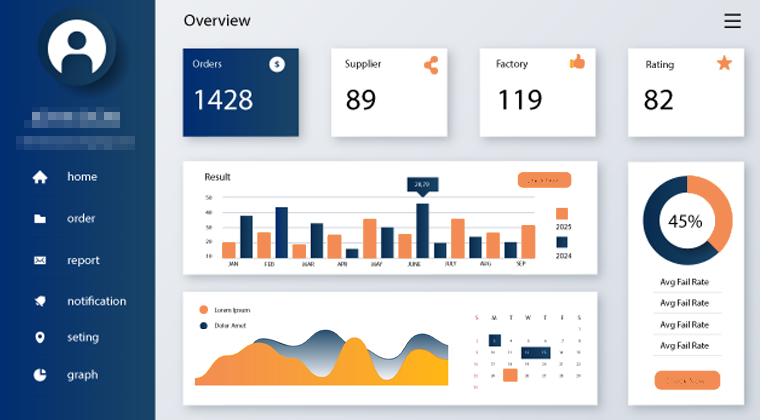
This section serves as a centralized dashboard that consolidates inspection data into a comprehensive Quality Command Center, enabling global buyers to monitor overall supply chain performance through multi-dimensional insights.
- Inspection Data Overview: Provides complete inspection data, including total inspections, suppliers, factories, fail rates, and AQL pass rates.
- Multi-Dimensional Analysis: Enables multi-dimensional analysis of inspection volumes by time, country, and product category.
- Trend Monitoring: Track your overall quality health over weeks, months, or quarters.
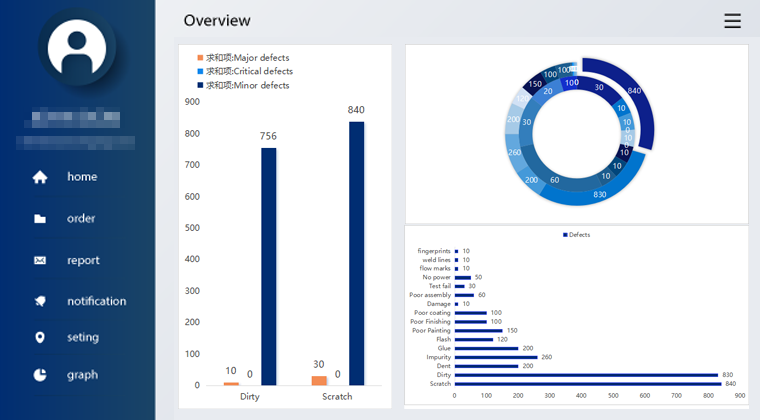
Section 2: Defect Analysis-Precision Analytics for Root Cause Identification
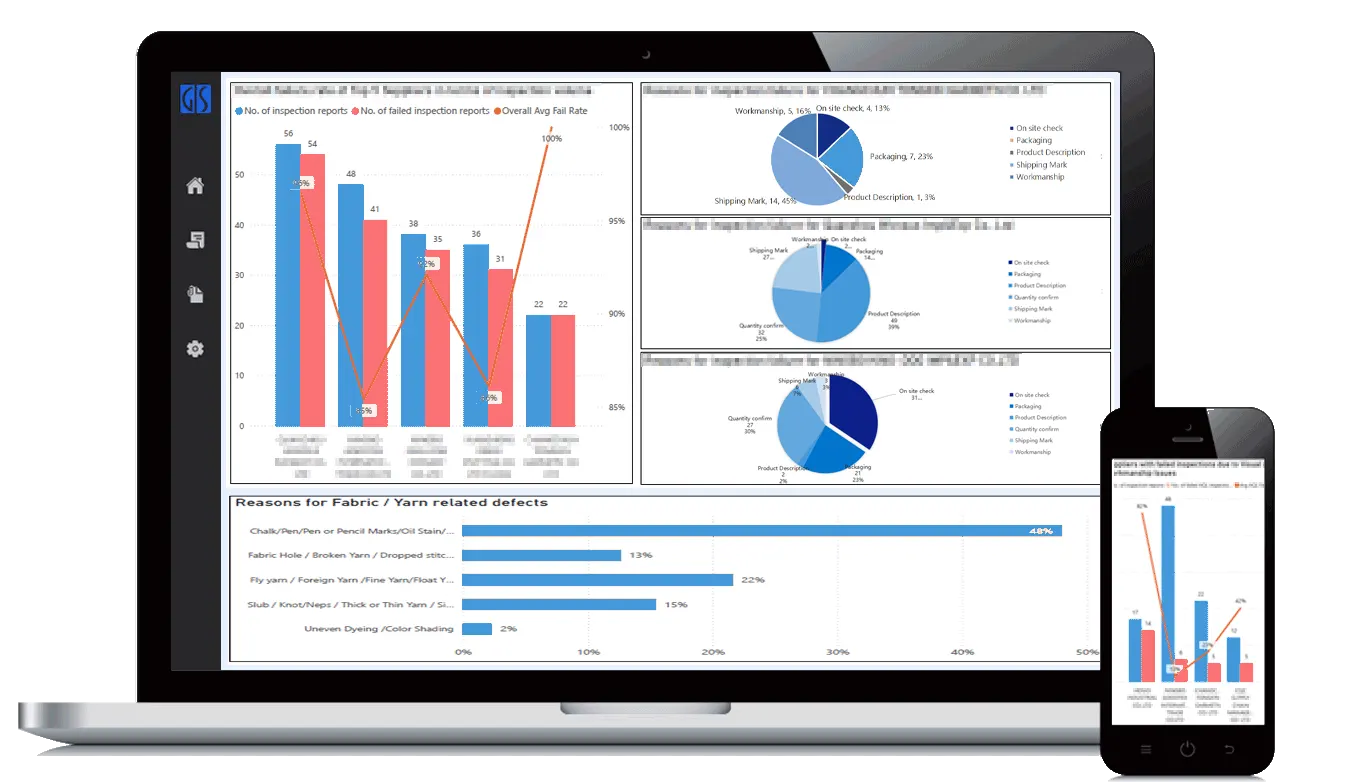
Identify exactly what is going wrong and where. GIS Intelligent Management System deconstructs all report to categorize and rank defects, helping your engineering and QA teams focus on what matters most.
- Defect Classification Charts: Visualize defects by the three AQL categories – Critical, Major, Minor.
- Top 5 Defect Frequency: Visualize the most common recurring issues (e.g., dirt, loose threads).
- Structural Data: Turn descriptive text into actionable charts for production improvement meetings.
Section 3: Factory & Supplier Performance – Secure Your Supply Chain
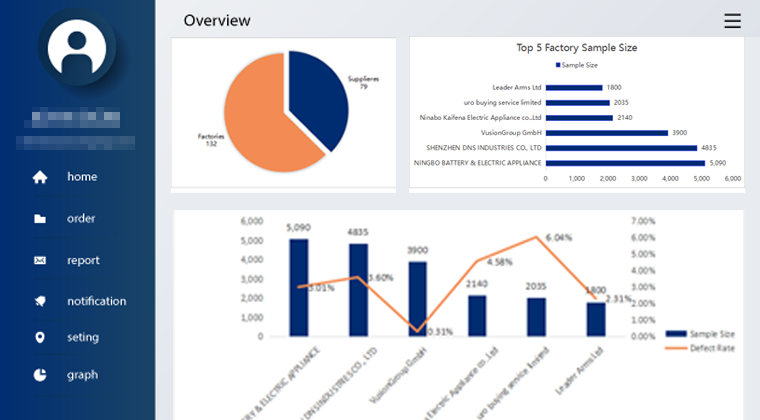
Who are your most reliable partners? Our system builds a digital "Quality Profile" for every factory and vendor in your supply chain based on historical inspection data.
- Defect Rate by Supplier: Compare the defect percentage across different factories to optimize your procurement strategy.
- The "Golden Vendor" Leader board: Rank suppliers based on their first-time pass rates.
- Supplier Risk Profiling: Use data to justify order allocations or to initiate necessary factory improvement plans (CAP).
Section 4: Report Repository & Details- Cloud-Based Traceability, Anytime, Anywhere
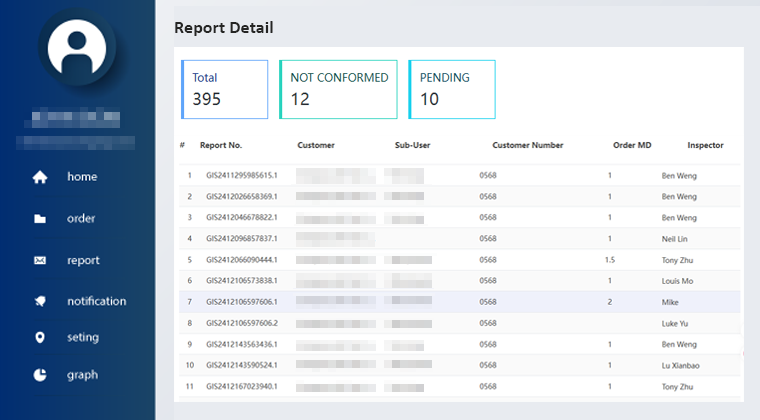
All your quality records are indexed and searchable. Whether you need a report from last week or last year, find it in seconds.
- Order Tracking: Monitor inspection progress in real time.
- Advanced Filters: Search by report, product, factory, or date range.
- High-Resolution Evidence: View detailed defect photos and test videos directly in the cloud.





Integrations for your Supply
Chain Management
From inspection data overview to defect analytics to comprehensive supplier management, see how GIS Inspection Client Quality Management System integrates inspection report data seamlessly into your centralized dashboard. Available exclusively for GIS Inspection partners.
Explore the Quality Management System

 Importers & Buyers
Importers & Buyers
Ensures supply chain safety through real-time tracking, data-driven analytics, and strategic supplier benchmarking for global buyers.

 E-commerce Brands
E-commerce Brands
Ensures supply chain safety through real-time tracking, data-driven analytics, and strategic supplier benchmarking for global buyers.

 Manufactures
Manufactures
Drives operational excellence by identifying production bottlenecks and providing technical insights for continuous quality and process improvement.
We’re happy to help
Get in touch with us
for additional information
Feel free to contact us anytime. We will respond to your inquiry as quickly as possible.
P: +86 180 5020 1963